Capstone Project
Trained a supervised model for land usage classification:
Problem Statement:
Due to the rapid urbanization and encroachment near Eco-Sensitive Zones, the government has decided to experiment with remote sensing technology for gathering timely and accurate measurements for changes in land usage around them. This will help with quick mitigating actions and can also track the results of recent re-forestation drives.
You are a data scientist in the task force assigned to derive its implementation. Historical surveys have resulted in annotated data about the state of land at those times along with the shapefiles associated with surveyed land. You will be responsible for conceptualizing end to end pipeline for training a supervised model for land usage classification i.e. data preparation, model training, and validation of results.
Technology
AI
Timeline
1 Month
Role
Student of PG-Cert
Date Completed
March 2023
Model Details
Creating the dataset
For my project, I have used 6 bands of a raster with the same spatial characteristics as predictor variables. We need labeled polygons in the shape of geopandas for our response variable using a GeoDataFrame so that the polygons are confined within the raster’s spatial range. Additionally, I made use of points, labeled pixels, and line shapes.
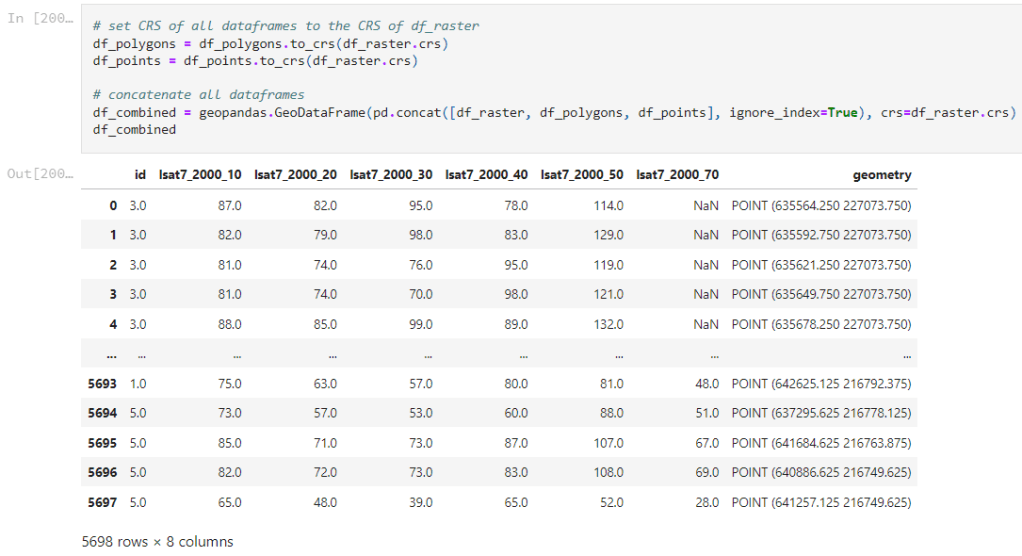
I combined raster data, points, and polygon data to get a combined dataset that could be used in train, test and validation
Classification Model
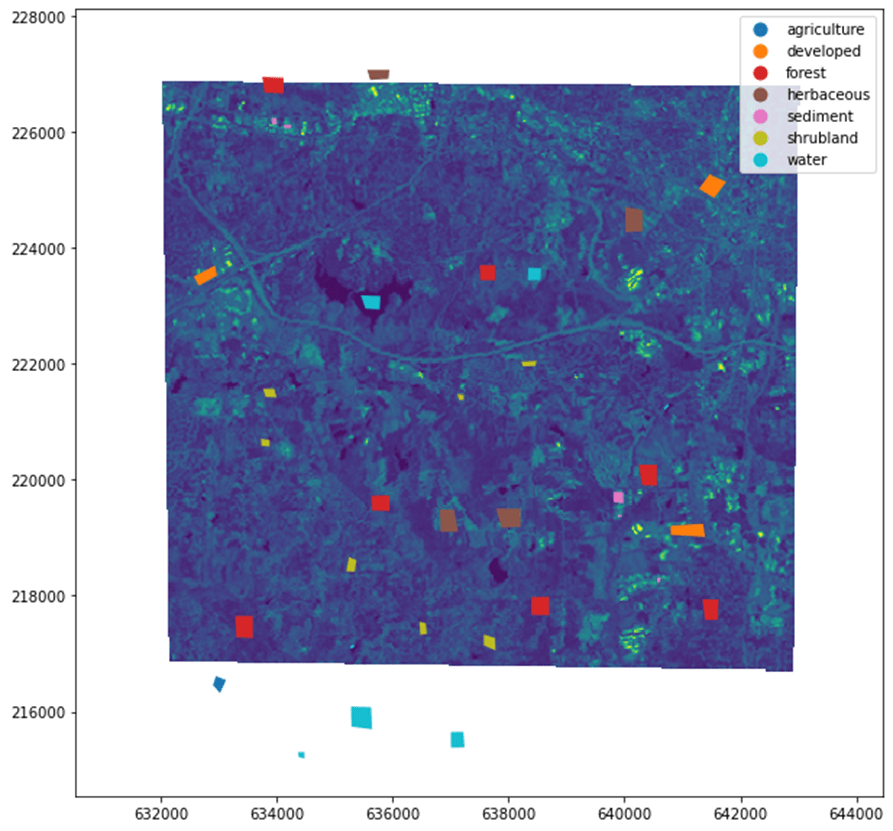
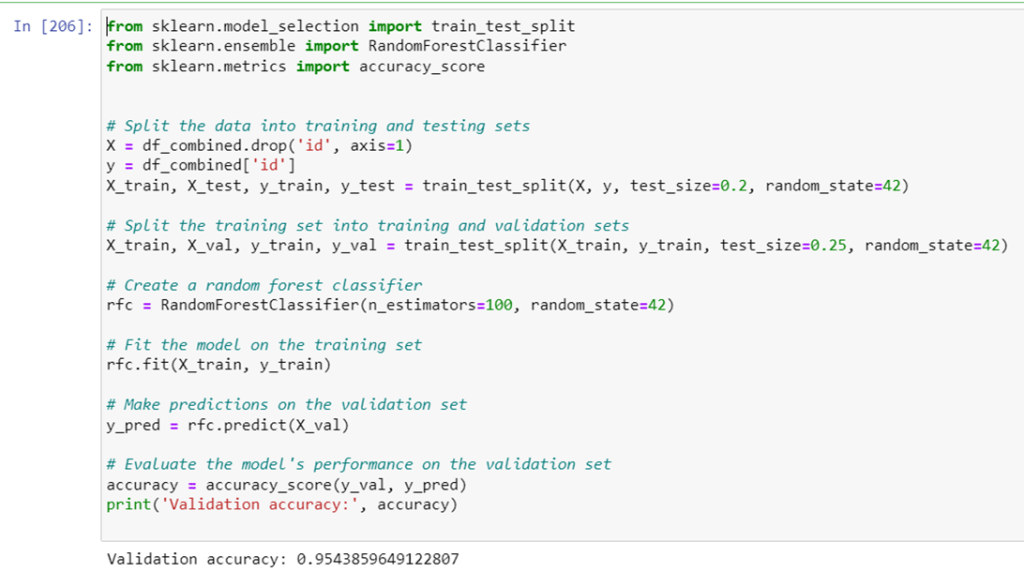
I developed a machine-learning model to classify satellite data (raster data) into one of the 7 labels namely agriculture, developed, forest, herbaceous, sediment, shrubland and water. I used RandomForestClassifier.
I got a Validation Accuracy of 0.95438.
After hyperparameter tuning, I received a Best Score of 0.9476
Multi-band raster stack
Presenting training data points on a single raster band using numpy and matplotlib:

Dataset Creation
training_py: This table consisted of a previously labeled ID along with X and Y coordinates of geometric polygons marked on the region of interest.

df_points: This data frame consists of spatial attributes from 6 satellites and the corresponding geometry.

I combined these tables to generate our dataset
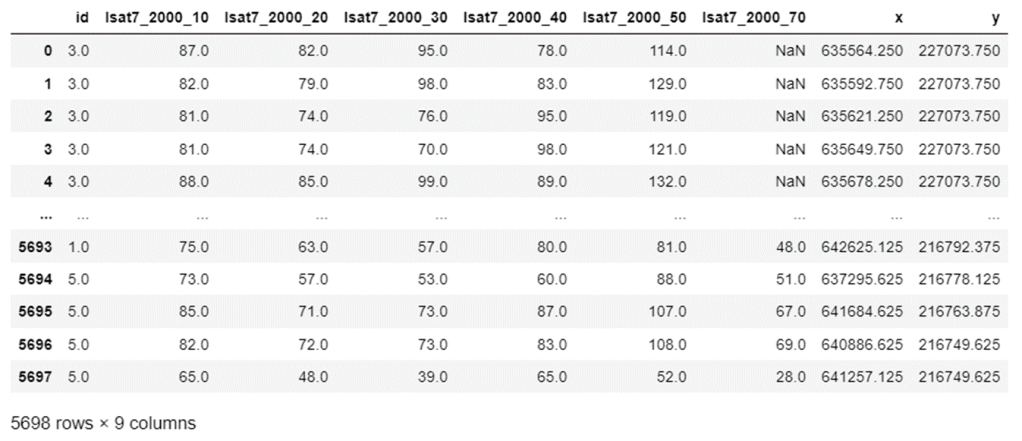
The geometry points are split into x and y to represent the values in cartesian coordinates.
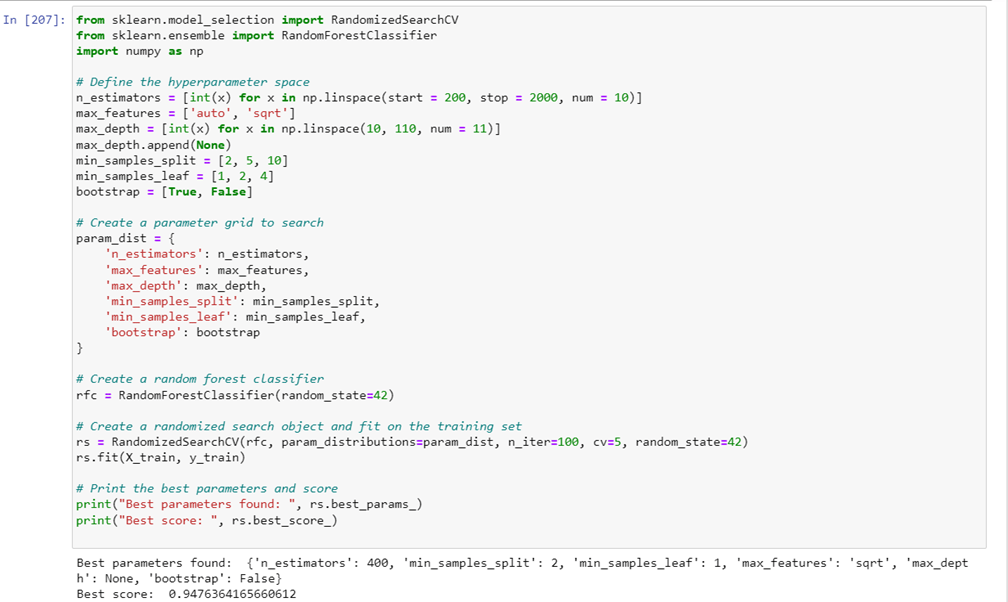
Training Model
I used Random Forest Classifier to create our model. We also evaluated Model performance using the Accuracy Score.
Hyperparameter Tuning
We found the best parameters and the best score using Hyperparameter Tuning