Abstract:
This project provides a solution to predict the possibility of detecting a fracture in one or more of the 7 cervical vertebrae of the Cervical spine. This would help radiologists detect a fracture in the cervical spine easily, which was otherwise a tedious task. The initial prediction could really help in the identification and treatment of cervical fractures. The motivation for this project comes from the Kaggle competition – ‘RSNA 2022 Cervical Spine Fracture Detection’, which enabled us to access the database and explore the possibility of constructing a Machine Learning model to make predictions on the probability of occurrence of a fracture, in one or several of the 7 cervical vertebrae. Our solution studies the EDA of the given databases and proposes a solution that could help in the prediction process.
Our strong EDA involved some of the best techniques like Bivariate analysis, Study of Heatmap, Skew of the data, distribution histogram of the various attributes, extraction of metadata, observation data, image drawing using coordinates, etc. This helped us understand the dataset better and hence enabled us to come up with this solution.
We have defined a scale-up function using the log loss function provided by the competition’s hosts. This helped us to make predictions on the test data and then submit the same on the Kaggle website to get a public score of 0.5677. We also discuss the possibility of using the Z-dimension in our future works to improve our prediction accuracy.
Introduction
In the United States alone, there are over 1.5 million spine fractures per year, resulting in about 17,730 spinal cord injuries. The cervical spine is where fractures in the spine most frequently occur. The prevalence of spinal fractures in the elderly has increased, and in this population, fractures may be harder to see on imaging because of coexisting degenerative illness and osteoporosis. Nowadays, computed tomography (CT) is almost completely used instead of radiography for the imaging diagnosis of adult spine fractures (x-rays). To stop neurologic degeneration and paralysis following trauma, it is crucial to locate any vertebral fractures as soon as possible.
In order to determine if artificial intelligence may be used to help in the diagnosis and localization of cervical spine fractures, RSNA has partnered with the American Society of Neuroradiology (ASNR) and the American Society of Spine Radiology (ASSR).
The challenge planning task force gathered imaging data from twelve sites across six continents, including almost 3,000 CT investigations, to construct the ground truth dataset. The existence, vertebral level, and location of any cervical spine fractures were indicated in these investigations by expert image-level annotations provided by spine radiology specialists from the ASNR and ASSR.
We attempted to create a machine-learning model for this competition that matched the radiologists’ performance in identifying and localizing fractures to the seven vertebrae that make up the cervical spine.
According to a Radiology study, artificial intelligence (AI) is a useful tool for fracture identification that has the potential to help physicians in busy emergency rooms.
Fracture diagnosis on X-rays that are missed or delayed might have catastrophic consequences for the patient. As radiologist recruitment continues to outstrip the expansion in imaging volumes, the issue is only made worse by a lack of timely access to expert advice.
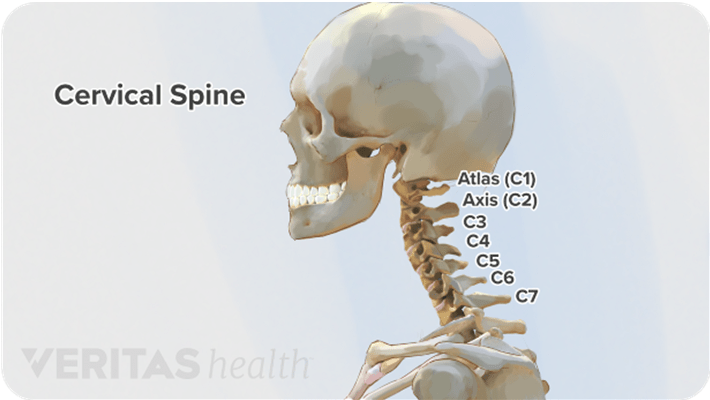
What are cervical fractures?
A cervical fracture, commonly called a broken neck, is a fracture of any of the seven cervical vertebrae (C1-7) in the neck. Abnormal movement of neck bones or pieces of bone can cause a spinal cord injury resulting in loss of sensation, paralysis, or usually instant death. AI could help solve this issue by supporting radiologists in their work by expediting and improving fracture diagnosis.
Our goal is to identify fractures in CT scans of the cervical spine (neck) at both the level of a single vertebra and the entire patient. Quickly detecting and determining the location of any vertebral fractures is essential to prevent neurologic deterioration and paralysis after trauma.
Origin of the dataset
The dataset we are using consists of over 3000 CT examinations from twelve different locations on six different continents. Annotations have been added by experts in spine radiology to show the existence, vertebral level, and location of any cervical spine fractures.
The competition hosts that have provided such a comprehensive dataset are:
- Radiological Society of North America (RSNA)
- American Society of Neuroradiology (ASNR)
- American Society of Spine Radiology (ASSR)
We had to forecast the likelihood of fracture for each of the seven cervical vertebrae identified by the letters C1, C2, C3, C4, C5, C6, and C7, as well as the likelihood that the cervical spine will sustain any fractures overall. This implies that the submission file will contain 8 rows, one for each image id. Notably, fractures of the thoracic spine, ribs, and clavicles are not taken into consideration. The competition metric is a weighted multi-label logarithmic loss (averaged across all patients)
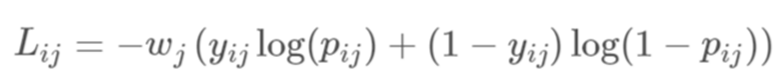
Where the weights are given by;
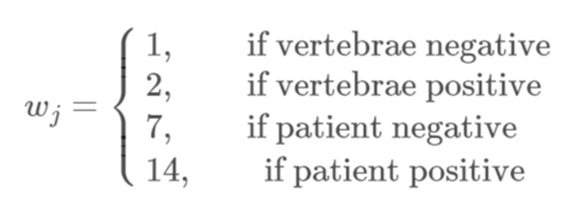
In the next figure, Notice how more weight is put on positive cases and the most weight on the overall probability of any fractures.

Fig 3: Weighted multi-label log-loss plot
I.3 The Dataset
Given below is a brief description of the dataset provided to us:
Our first dataset is a CSV file called train.csv. It consists of a total of 2019 unique IDs with marking indicating the presence of a fracture in one or more of the cervical vertebrae. There are 8 target columns. The first one is the patient overall column indicating ‘1’ or ‘0’ for each unique StudyInstanceUID if there is an occurrence of fracture in at least one of the 7 cervical vertebrae or not respectively. This is followed by 7 columns indicating the presence of fracture in each of the 7 cervical vertebrae with the value ‘1’ (‘0’ otherwise). The tabulated version of this dataset is shown in the figure below:
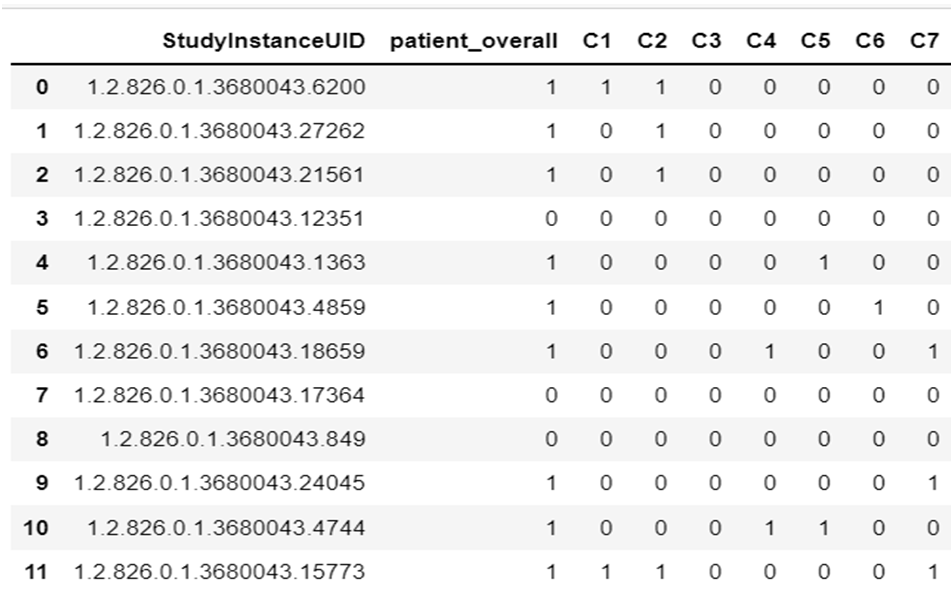
Table 1: train.csv represented in tabular form
train.csv
StudyInstanceUID – The study ID. There is one unique study ID for each patient scan.
Number of rows: 2019
patient_overall – One of the target columns. The patient-level outcome, i.e., if any of the vertebrae are fractured.
C[1-7] – The other target columns. Whether the given vertebrae are fractured. See this diagram for the real location of each vertebra in the spine.
The second dataset provided to us is also a CSV file called train_bounding_boxes. This provides us with the coordinates for the bounding boxes to be drawn onto the scanned images. The definitions of the columns are as below:
train_bounding_boxes.csv – contains bounding boxes of where fractures occurred for a subset of the training set.
- StudyInstanceUID – The study ID. There is one unique study ID for each patient scan.
- x – x-coordinate of bounding box bottom left corner
- y – y-coordinate of bounding box bottom left corner
- width – width of the bounding box
- height – the height of the bounding box
- slice_number – slice number of scan

Table 2: train_bounding_boxes represented in tabular form
After training our model, we need to make predictions on the test_df.csv provided by the host. Given below is the test dataset given by the host.

Table 3: test_df represented in tabular form
There are 320919 .dcm files (CT Scans) provided by the hosts.
Methods
Before deciding on the model and making predictions, we wished to do an Exploratory Data Analysis of the given data. Data scientists use exploratory data analysis (EDA), which frequently makes use of data visualization techniques, to examine and analyze data sets and summarize their key properties. It makes it simpler for data scientists to find patterns, identify anomalies, test hypotheses, or verify assumptions by determining how to modify data sources to achieve the answers they need.
EDA helps with a better understanding of the variables in the data collection and their relationships and is usually used to investigate what data might disclose beyond the formal modeling or hypothesis testing assignment. It can also assist in determining the suitability of the statistical methods you are considering using for data analysis.
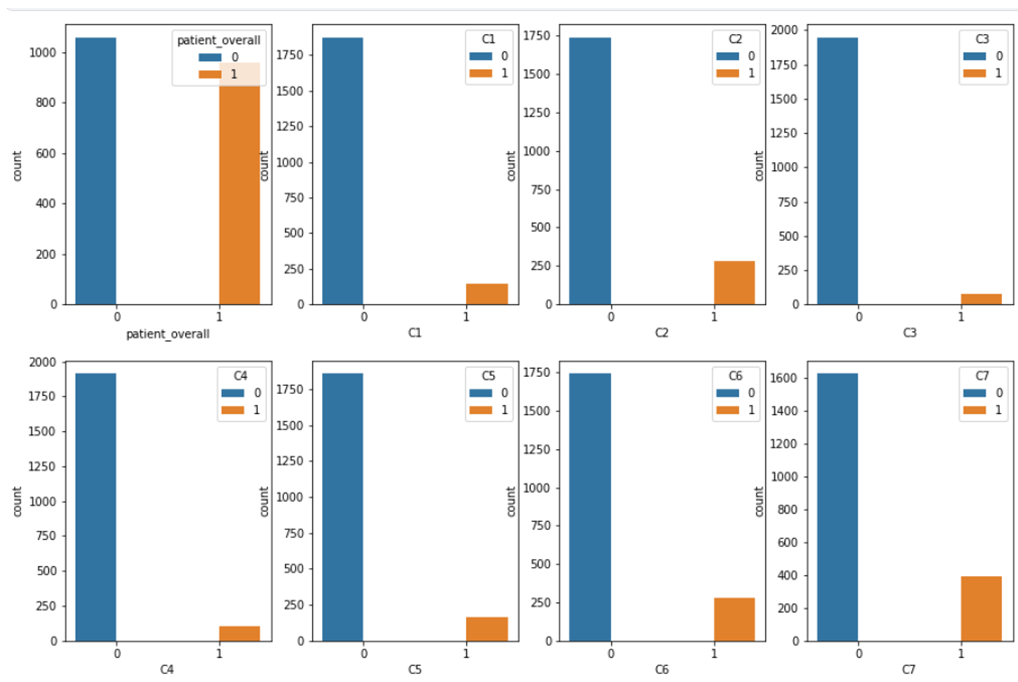
Bivariate Analysis
We first tried to plot a bivariate graph of each column from train.csv to find out the number of positive cervical vertebra fractures. This helped us understand that a substantial amount of fractures exist on each cervical vertebra.
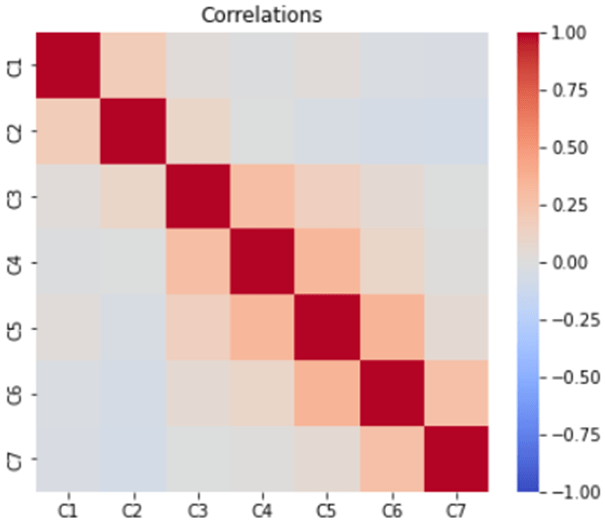
Correlation Matrix
A correlation analysis can be used to find the relationship between the various columns of a dataset. Here we observe that there is a possibility of adjacent cervical vertebrae also being fractured in case of one of the 7 cervical vertebrae is fractured.
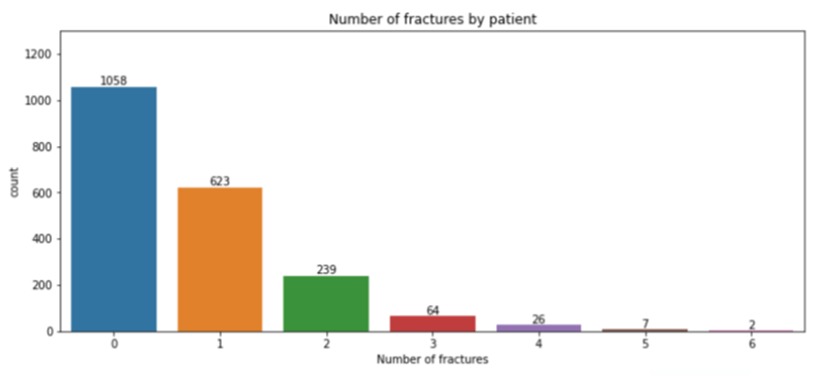
Plotting number of patients with fracture in each cervical vertebra. We observe that vertebrae 0 has highest number of fractures reported in our dataset.
Patients with bounding boxes and lack of sufficient data
We found that only 235 (11.6 %) of patients have bounding box measurements.With all the image processing we have done so far, we could gain very less idea of using the image information in a model, so we then tried another method to mathematically use the formula given by the hosts and enhanced the result to produce a scale-up function that gave a better mean value of each column.

We are going to find the optimal constant submission using calculus. Others have shown us how to do a simple baseline using the mean fracture probabilities. But we wanted to make sure that we take into account the fact that we know the loss weights.
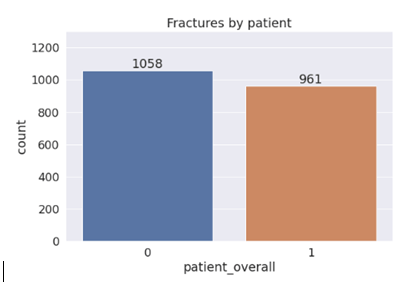
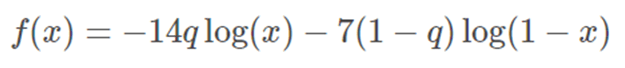
First we started with the overall patient category. We know that positive cases have a weight of 14 and for negative cases we have a weight of 7. Let q denote the proportion of positives for this category. (We found in the EDA section that q=0.476). Then define the function.
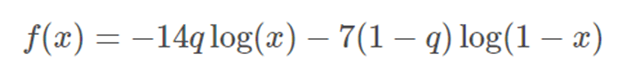
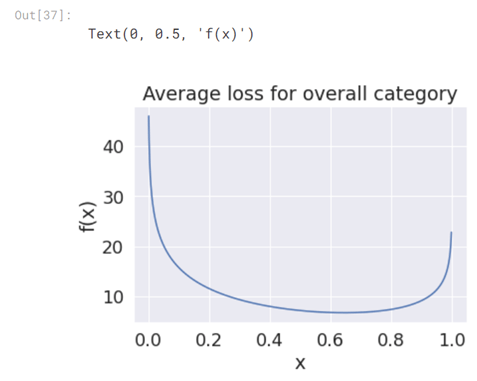
This is be the average loss for this category assuming we predict the same number (xx) every time.
Overall patient count of positive and negative (‘1’ and ‘0’) in occurrence of cervical vertebrae fracture is given in the graph below:
The average log loss plot looks like the figure below:
Deduce the scale – up function
We want to find the value of x that minimizes this function. With the knowledge of calculus, we found that we need to calculate the derivative and set it equal to 0. That is, solve

Luckily, the only derivative we need to know is that of the natural logarithm, which is given by;
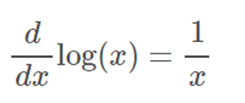
Using Chain rule we have,
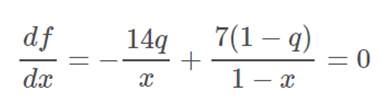
We hence derive,
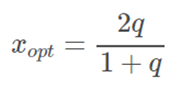
for q=0.476, this comes out to be xopt=0.645
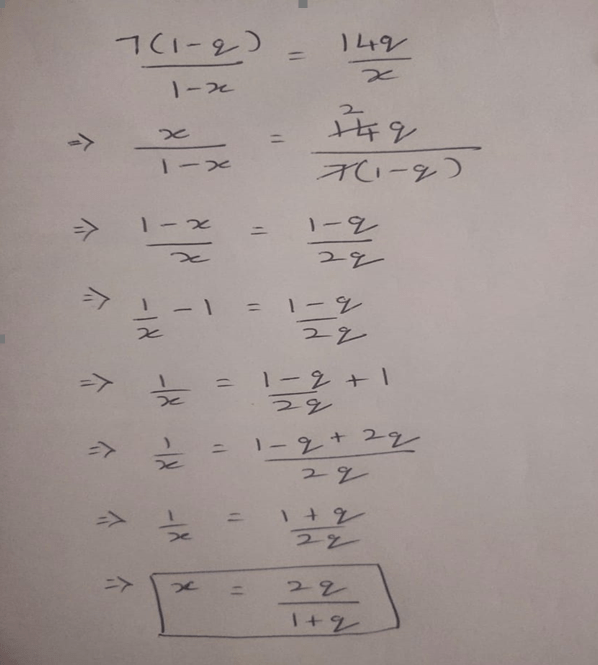
Calculation on paper:
RESULTS
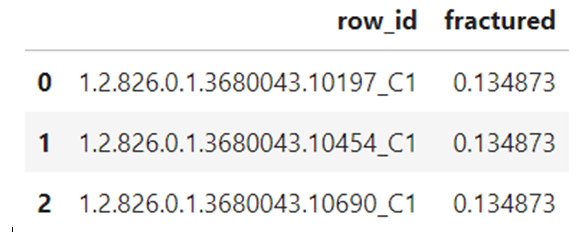
The Deduce function was applied onto the training data to obtain the following predictions:
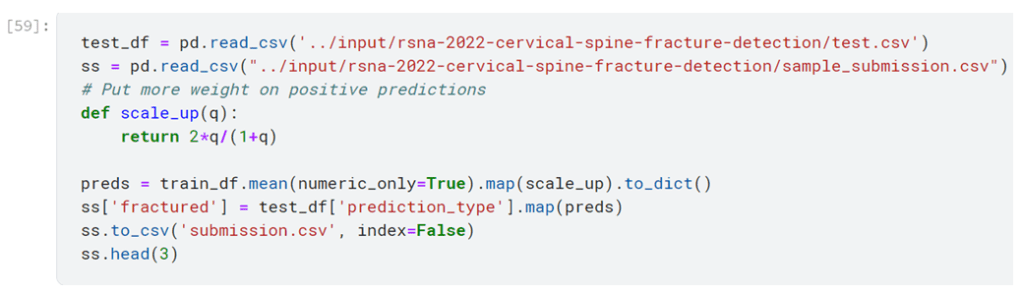
Prediction
This output was submitted to Kaggle and a public score was obtained. Given below is the private and public score obtained in Kaggle:

This was quite satisfactory as some of the bronze button holders had gotten results in this range.
