Abstract
This report’s objective is to share our analysis and visualization of the most recent Top500 list, which was published in November 2022. The top 500 most potent computer systems in the world are listed annually by Top500.org, and this list offers important information on the state of high-performance computing (HPC) at the moment and its tendencies.
In order to show the feature trends and HPCG list for November 2022, we used Tableau and Python in this project. Our analysis offers a thorough overview of the HPC ecosystem and emphasizes the salient traits and emerging trends of the most potent computer systems.
Links:
Introduction
The Top500 and the HPCG lists
The TOP500 List, which is updated twice a year, offers helpful perceptions into the trends and advancements in the high-performance computing (HPC) industry. The TOP500 List’s main objective is to provide a ranked list of all-purpose computers that are often used for high-end tasks including data analytics, weather prediction, and scientific research. The performance of the most potent commercially accessible computer systems in the world is measured with the help of the TOP500 List. According to their performance on the LINPACK Benchmark, a widely used criterion for gauging a computer system’s floating-point performance, the list shows the 500 most powerful computers.
The list offers a thorough overview of the latest developments in HPC hardware and software, including the usage of accelerators and coprocessors, the creation of novel architectures, and the growing emphasis on energy efficiency. The list has developed into a crucial yardstick for assessing the advancement of HPC and has encouraged companies and researchers to innovate and compete.The TOP500 List is a resource for understanding technological progress in the area and not only a rating of the most potent supercomputers.
The HPCG List, which is based on the High-Performance Conjugate Gradient (HPCG) benchmark results, offers an alternate criterion for evaluating supercomputer performance. The HPCG List gauges how well a system performs while utilizing the Conjugate Gradient method to solve a system of linear equations, as opposed to the TOP500 List, which concentrates on the LINPACK Benchmark, which gauges a system’s floating-point performance. The workloads that supercomputers are expected to manage in scientific and technical applications are becoming more and more complicated, and this benchmark is made to reflect that. The HPCG List thus offers a second perspective on supercomputer performance and draws attention to the systems that are best at handling challenging issues.
The TOP500 list consists of 500 systems. Whereas, the HPCG list contains 106 systems. While the Top500 list measures how quickly a system can solve a set of linear equations focusing on matrix-matrix multiplications, the HPCH list measures how quickly a system can solve a large system of linear equations using conjugate gradient algorithm. The important attributes to be observed in the Top500 list are the Rmax (Tflops/sec) and the Rpeak (Tflops/sec), whereas HPCG (Tflops/sec) is the important attribute of the HPCG list.

| Visualizations | Count |
| Pie Chart | 5 |
| Bar Graph | 8 |
| Gantt View | 2 |
| Packed Bubbles | 1 |
| Treemaps | 12 |
| Side-by-Side Bars | 1 |
| Highlight Table | 4 |
| Horizontal Bars | 10 |
| Text Tables | 2 |
| Total : | 45 |
Visualization Tools
Python is a well-liked programming language that offers a wide variety of tools for visualizing data, making it a potent tool for producing eye-catching visualizations. To show the most recent TOP500 and HPCG lists for our project, we used numerous Python tools, including Matplotlib, Pandas, and Seaborn.
The popular Python plotting toolkit Matplotlib provides a variety of visualizations, such as line, scatter, and bar charts. Users can change the colors, labels, and other design components to create powerful visualizations because to its high degree of customization. When examining large datasets, Seaborn is a statistical data visualization library that provides a variety of complex visualizations, such as heatmaps, pair plots, and distribution plots. Pandas is a toolkit for data analysis that offers capabilities for data aggregation and modification, making it ideal for prepping data for visualization.

The business intelligence and data visualization program Tableau has grown in popularity recently. It gives customers easy access to interactive, intuitive data analysis, visualization, and sharing. Tableau is accessible to consumers with diverse degrees of technical expertise, from novices to advanced users, thanks to its user-friendly interface. Tableau’s capability to develop and distribute dashboards and visuals is one of its main advantages. Users can share their thoughts and discoveries with others using this feature, making it a great tool for teamwork and knowledge exchange.
Tableau provides a selection of data visualization tools that let users build different charts, graphs, and dashboards to aid in exploring and comprehending their data. Large datasets can be handled by the program, which makes it a great option for companies and other organizations that need to analyze and make sense of complex data.

VISUALIZATION USING PYTHON
Pie chart – Grouping on the basis of the Interconnects
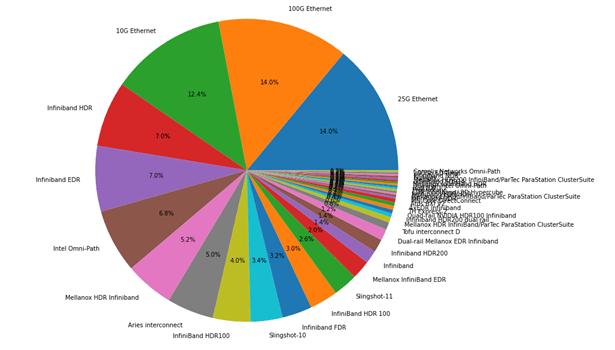
This is a pie chart depicting the different interconnects used by the supercomputers from the TOP500 list. It shows the information in terms of percentage.

This is a pie chart depicting the different interconnects used by the supercomputers from the top 20 systems of the TOP500 list. It shows the information in terms of percentage.
Bar Graph – Grouping on the basis of the Interconnects

Here we try to depict the number of systems using different Interconnects in a bar chart for Top500 list.
X-axis depicts the different Categories of Interconnect Y-axis depicts the frequency

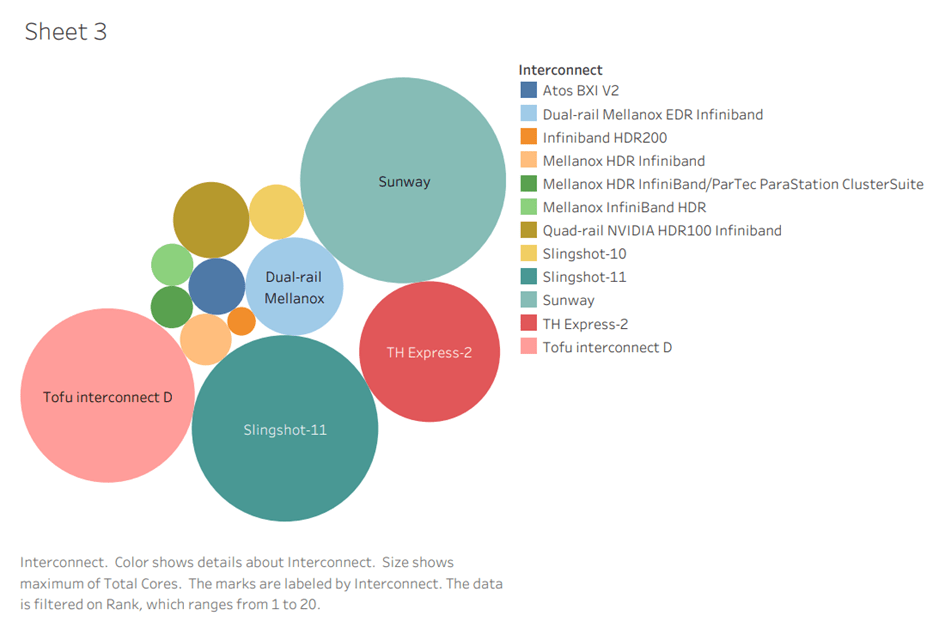
Here we try to depict the number of systems using different Interconnects in a bar chart for the top 20 systems of the Top500 list.
X-axis depicts the different Categories of Interconnect
Y-axis depicts the frequency
Grouping the Dataframe – by Interconnect
Displaying the number of systems with respect to Interconnect in Pie and Bar charts was an easy task. Grouping the entire data-frame with respect to Interconnect was a tedious task. We found two different methods to achieve this. First, we used the pivot_table function from Pandas to group the first 20 systems in the list. Second, we used the melt function to melt the columns and sort the data with respect to interconnect. However, we were facing a major challenge with our approach; Both methods produced the same result with one major problem. We were able to sort the dataframe with respect to Interconnects, but the multiple rows under each unique Interconnect (also referred to as duplicates in Python) were getting sorted as lists of values for each column in sequential order. This led us to look for different tools that would ease our visualization process. We found Tableau helpful in this sense. In the following chapter, we shall see how Tableau simplifies combining multiple columns and hence gives a great user experience for visualization.
VISUALIZATION USING TABLEAU
Tableau
Tableau is a powerful business intelligence and data visualization software that allows users to easily analyze, visualize, and share data in an interactive and intuitive way. It was created by Tableau Software, which was acquired by Salesforce in 2019.
Tableau software is known for its user-friendly interface, which enables users to create and publish visualizations and dashboards without requiring extensive knowledge of programming or data analysis. The software supports a wide range of data sources, including spreadsheets, databases, and cloud-based sources, and offers a variety of data preparation and cleaning tools.
One of the key features of Tableau is its drag-and-drop interface, which allows users to quickly and easily create charts, graphs, and other data visualizations. The software also provides a wide range of customization options, including the ability to add filters, create calculations, and use advanced analytics functions such as forecasting.
Tableau offers a range of deployment options, including on-premises, cloud-based, and hybrid solutions, and provides a variety of licensing options to suit the needs of different organizations. Additionally, Tableau offers a robust online community of users who share best practices, tips and tricks, and resources to help others make the most of the software.
Overall, Tableau is a highly versatile and user-friendly tool for data visualization and analysis that is widely used by businesses, non-profits, and other organizations to make data-driven decisions and share insights with stakeholders.

Tableau Public
Users can create and share interactive data representations online using Tableau Public, a free data visualization application. A variety of tools and functionalities are available on this cloud-based platform for building dynamic dashboards and visualizations. Using their own data or publicly available datasets, users of Tableau Public can produce maps, charts, graphs, and other kinds of visualizations.
The user-friendly interface of Tableau Public makes it simple to create and share data visualizations. Users have the option to publish their work online, edit the style and feel of their visualizations, and add interactive elements like filters and tooltips. Once released, Tableau Public visualizations can be viewed on the Tableau Public website, shared on social media, or embedded in websites.

VISUALIZING THE TOP500 SYSTEMS LIST
Ranking

In the Gantt view visualization given above, we can make the following observations:
- Most of the highest-ranking achievements were made in the years 2020, 2021 and 2022.
- Slingshot 11 and Mellanox HDR InfiniBand are the interconnects used by most systems in the Top-20 list.
- Supercomputer Fugaku has not been able to improve its ranking since 2020.
- Sunway TaihuLight has not been able to improve its performance since 2016.
- Sierra and Summit have given hope for the Dual-rail Mellanox EDR Infiband interconnect by standing in 6th and 5th positions respectively.
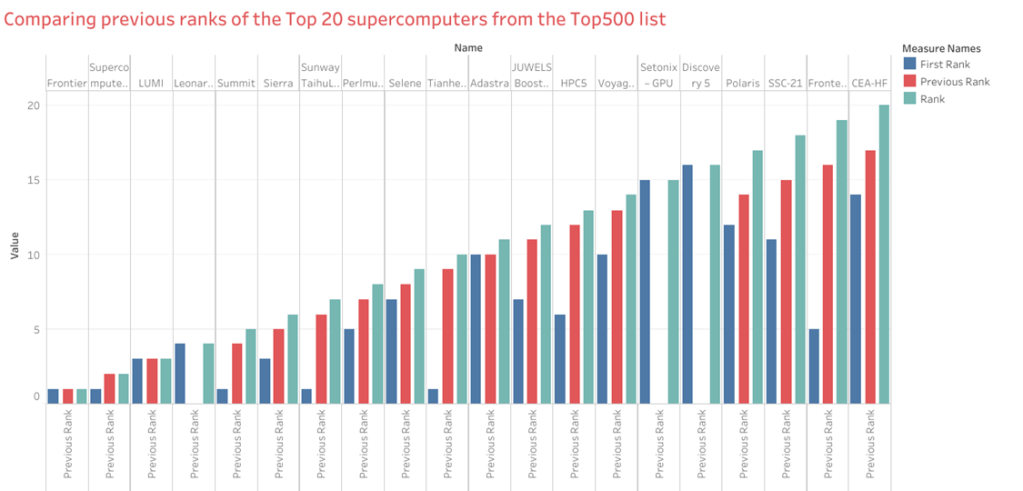
Different Rankings in the Top500 list
There are three columns for ranking in Top500 list:
- First Rank: The Rank when the system appeared in the Top500 list for the first time
- Previous Rank: The Rank in the previous Top500 list
- Rank: Rank og the system in the current list.
Rpeak and Rmax
Rpeak (peak performance) is the theoretical maximum performance that a computer system can achieve, based on its hardware specifications. It is typically measured in floating-point operations per second (FLOPS), and represents the upper limit of what the system is capable of achieving under ideal conditions.
Rmax (maximum performance) is the actual performance achieved by a computer system on a specific benchmark or set of applications. It is also typically measured in FLOPS, and represents the real-world performance of the system in a specific context.
While Rpeak is a useful metric for understanding the theoretical capabilities of a computer system, Rmax provides a more accurate measure of its practical performance in real-world applications. HPC experts often use these metrics to evaluate and compare the performance of different computer systems, as well as to identify areas for optimization and improvement in HPC applications.

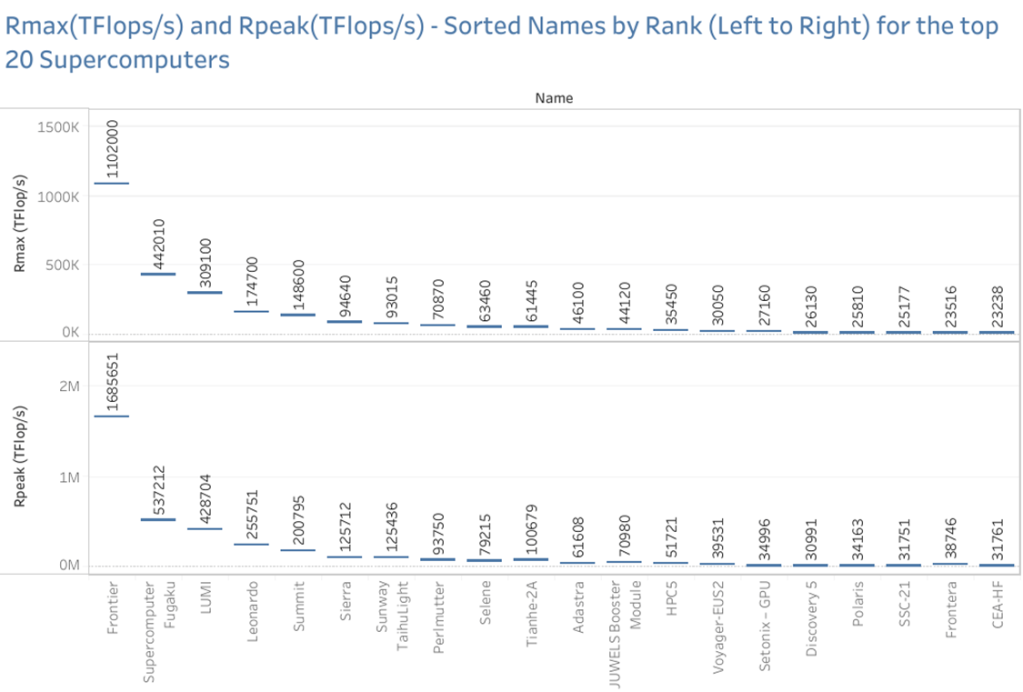
Below are the conclusions that can be drawn from the Gantt Visualization above:
- The Rmax value for the Frontier Supercomputer is more than double that of its very next ranked Fugaku Supercomputer.
- The rate of change in Rmax is very less in subsequent ranks, post the third-ranked Supercomputer.
- The Rpeak estimated for Frontier Supercomputer was 1685651 Tflops/sec, so there still might be some more scope of improvement in the achievable Rmax. The current Rmax is at 1102000 Tflops/sec.
- Tianhe-2A expected a theoretical Rpeak of 100679 Tflops/sec, but could only achieve an Rmax of 61445, there might be some scope of improvement here.
- Study on various other factors like Interconnect, operating system, number of cores, power usage, etc., could help us find ways for supercomputers to improve their performance.
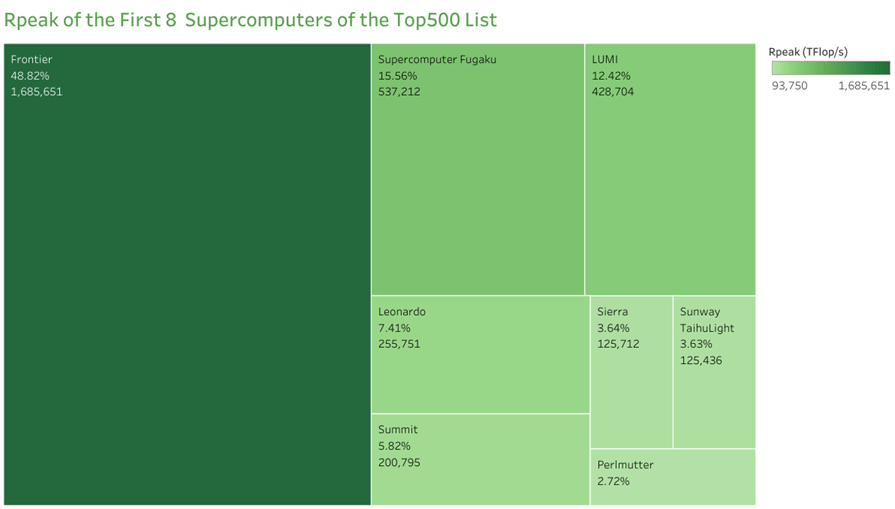
Observation:
Rpeak of Frontier Supercomputer is almost equal to the next 7 Supercomputers combined!

Observation:
Rmax of Frontier Supercomputer is almost equal to the next 5 Supercomputers combined!
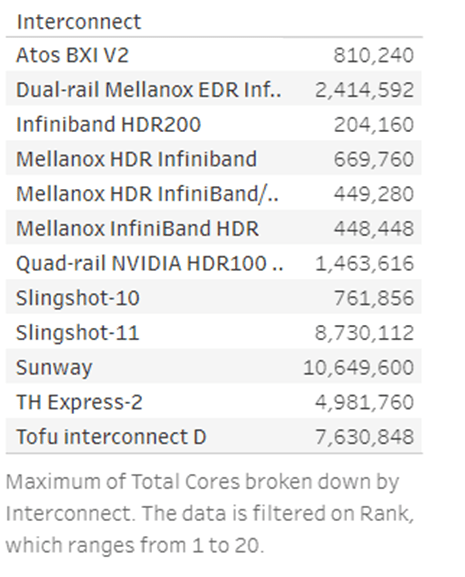
Total Cores by different Interconnects
Power consumption by the top 20 Supercomputers of the Top500 list
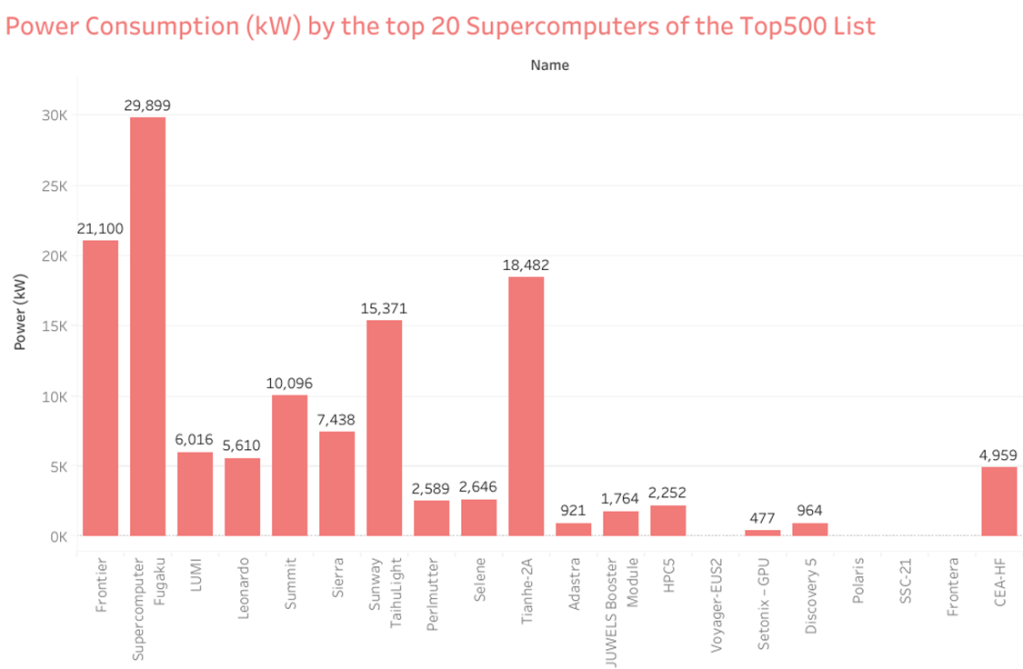
The following conclusions can be drawn from the bar graph above:
Frontier consumes way less power when compared to Supercomputer Fugaku. Interestingly, Frontier outperforms Supercomputer Fugaku and is ranked 1st in the list ( Fugaku is ranked second). LUMI and Leonardo consume way less power when compared to Summit Supercomputer. Likewise, Sierra consumes lesser power than Sunway TaihuLight. Perimutter and Selene outperform Tianhe – 2A in optimum power consumption.
Supercomputing Systems by country
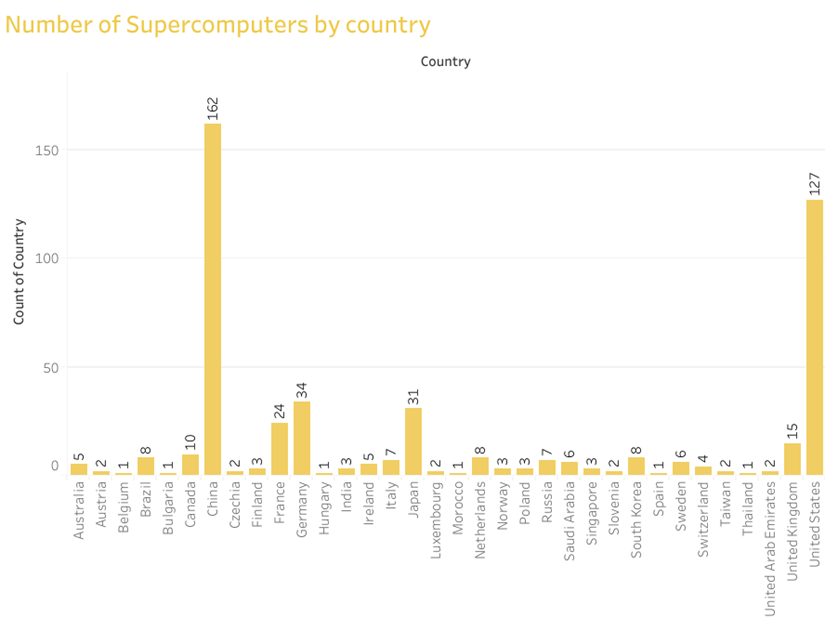
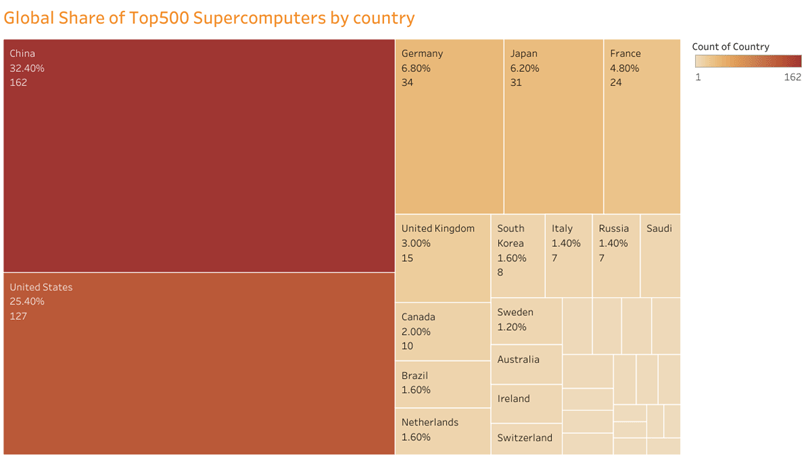
Observation:
- China and USA have a Lion share in owning the number of Supercomputers in the Top500 list
- China and USA own more than 57% of the world’s Top 500 Supercomputers.
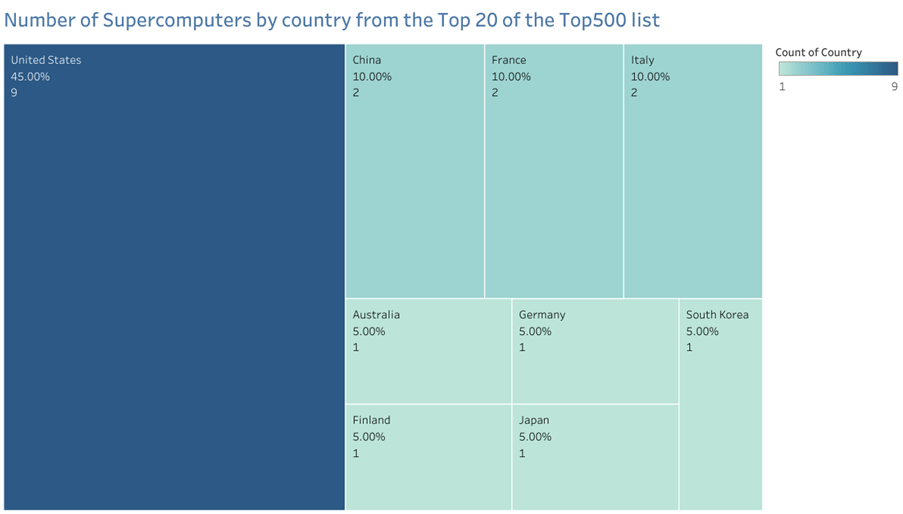
Observations:
- USA owns 45% of the top 20 supercomputers in the world, taking the count to 9.
- Though China owns 162 (32.4%) of the Top500 Supercomputers, it only has 2 of its supercomputers in the Top20 list.
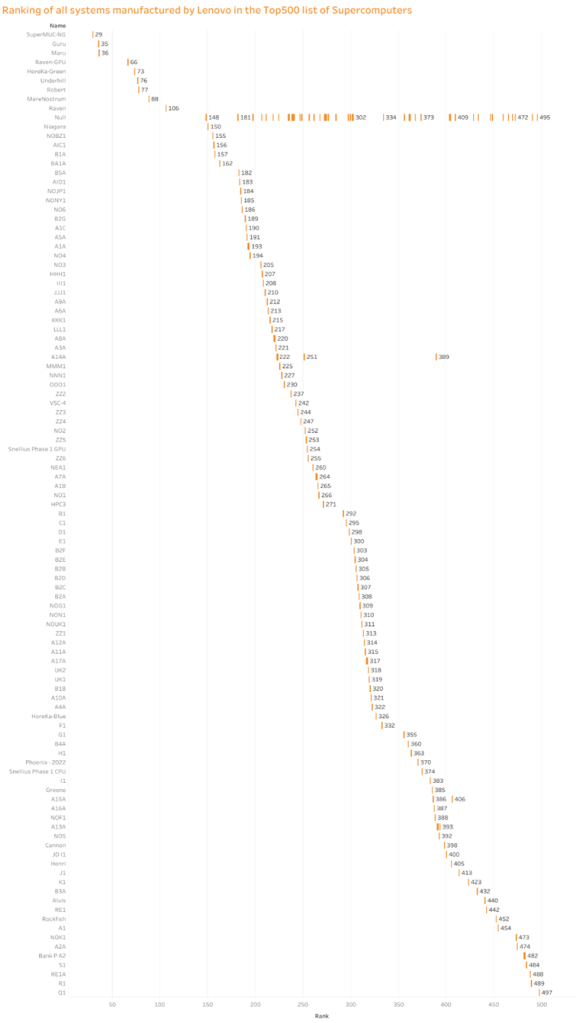
Manufacturers
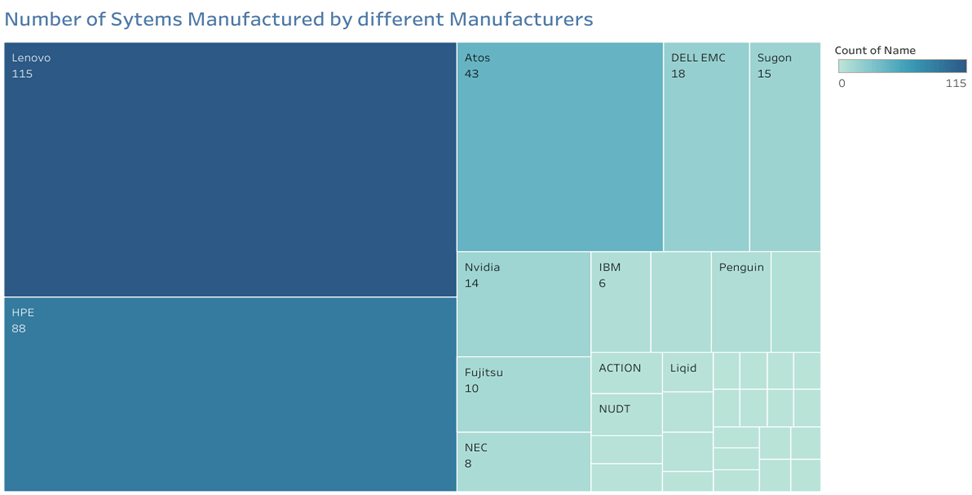

The Top500 list’s Manufacturers category refers to the businesses that make the supercomputers that are listed. Large computer manufacturers or vendors like IBM, Hewlett Packard Enterprise (HPE), Cray, Lenovo, Fujitsu, and Dell are typical examples of these businesses. It is observed from the above tree map and pie-chart that Lenovo manufactures 31.4% of all the
Some of the most potent computer systems in the world—used for a variety of purposes, such as scientific research, weather forecasting, and defense—are created, produced, and delivered by these manufacturers. The success of the manufacturers in the market depends on their proficiency in creating and constructing high-performance computer systems.
The Top500 list categorizes the manufacturers according to the quantity of systems they have listed and overall performance. These businesses can use the list as a useful benchmark to assess their performance and demonstrate their capabilities to clients, academics, and investors. Additionally, it offers information on the state of the market and technological advancements in supercomputing.
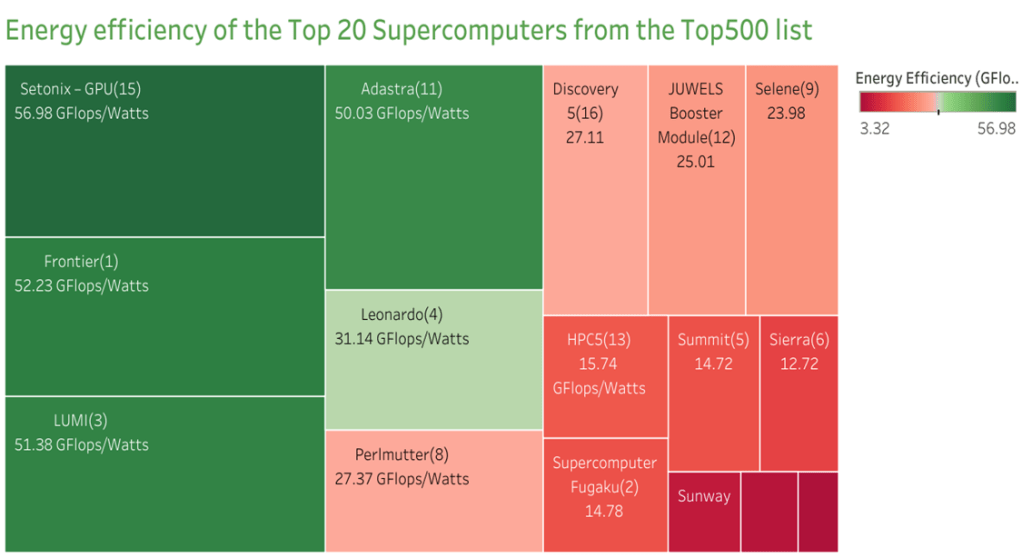
Energy Efficiency
Energy efficiency in the Top500 supercomputers list measures the amount of processing power a supercomputer can deliver per unit of energy consumed.
The standard unit of measurement for this parameter is floating-point operations per watt (FLOPS/W).
Increasing the development of supercomputers that can carry out more calculations while consuming less energy would lessen the impact these systems have on the environment and lower their operating expenses. From 2010, the Top500 list has now included a ranking of the most energy-efficient supercomputers based on their FLOPS/W.
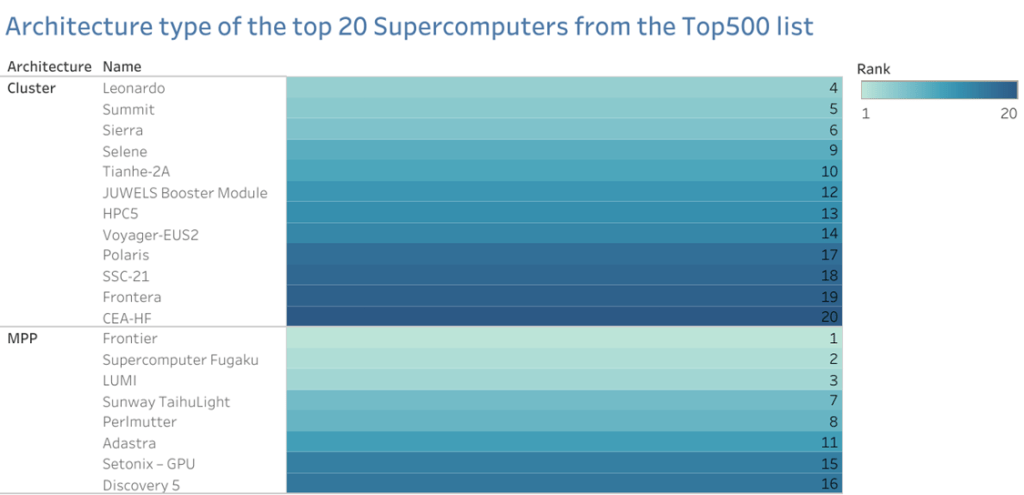
Architecture Type
The Top 500 supercomputers list categorizes them according to their architecture type, which includes the kind of processors, interconnects, memory, and storage they utilize.Many designs, including those based on conventional CPUs, graphics processing units (GPUs), field-programmable gate arrays (FPGAs), or specially created processors, can be used in supercomputers.
Moreover, supercomputers might make use of specialized interconnects that enable quick data transport between various system components. Different architectures may be better suited for various types of applications or workloads, which can have a substantial impact on a supercomputer’s performance and energy efficiency. In order to help researchers and engineers better understand the capabilities and limitations of each supercomputer, the Top 500 list contains information on the architecture type of each one.
Cluster and MPP
Two typical types of supercomputer architectures are cluster and MPP (Massively Parallel Processing) systems. Several independent computers, or nodes, linked together by a fast network make up a cluster design.
The cluster’s nodes cooperate to solve a computing issue, and each node usually has its own CPU, memory, and storage.
Cluster topologies can grow out to include thousands or even tens of thousands of nodes and are frequently used for parallel computing applications including simulations, data analysis, and scientific modeling. The MPP architecture, on the other hand, makes use of numerous processors that collaborate to complete a single task in order to provide huge parallelism.
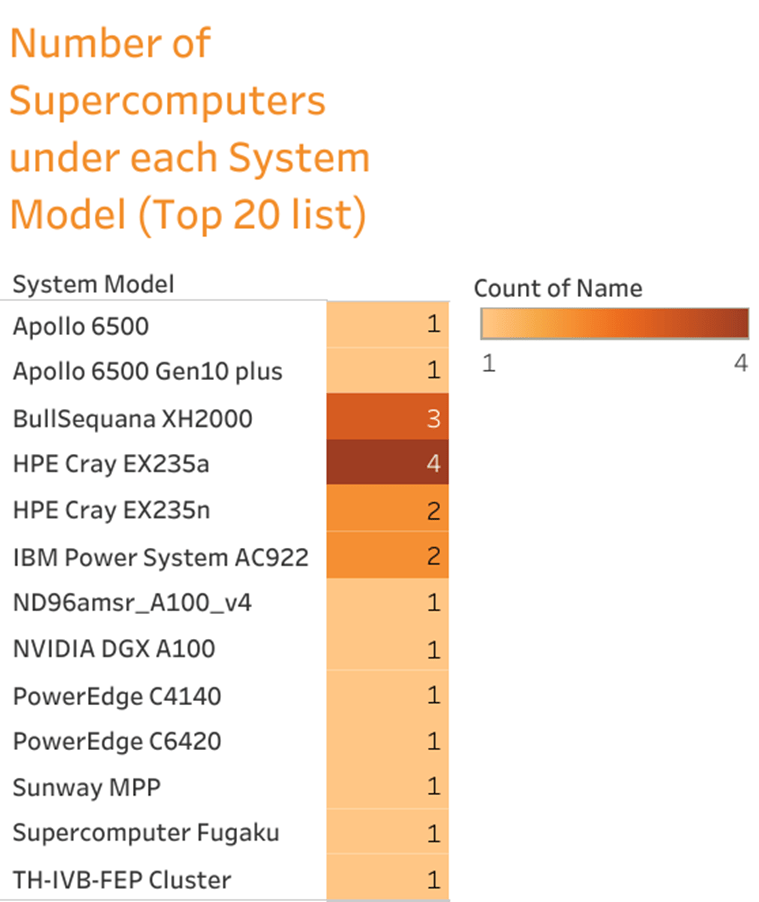
Models
The Top500 list’s System Model designates a supercomputer’s particular setup of hardware and software that has been evaluated for performance and scored. The Top500 list is a biannual ranking of the most potent supercomputers in the world based on how well they perform when running the LINPACK benchmark program. The System Model, which contains details about a supercomputer’s processor architecture, number of cores, memory size, and other pertinent technical data, is used to identify each supercomputer on the list.
Processors
The central processing unit (CPU) or group of CPUs employed in a supercomputer’s System Model to carry out calculations is referred to as a processor in the Top500 list. One of the main determinants of the supercomputer’s total performance and position on the list is the performance of the processor. The Top500 list includes comprehensive details about each supercomputer’s CPU, including the maker, model, number of cores, clock speed, and other technical details.
The majority of the processors found in the top-ranked supercomputers are specialized high-performance processors created for certain purposes, like field-programmable gate arrays (FPGAs) or graphics processing units (GPUs) (FPGAs).

Accelerator/Co-processor
There are several different types of accelerators and co-processors that are commonly used in the systems ranked on the TOP500 list. Here are some examples:
- GPUs (Graphics Processing Units): These are specialized processors originally designed for rendering graphics in video games, but have been adapted for scientific and engineering computations. Examples of GPUs include those from NVIDIA and AMD.
- FPGAs (Field-Programmable Gate Arrays): These are configurable integrated circuits that can be programmed to perform specific computations, making them well-suited for custom applications. FPGAs are commonly used in fields such as cryptography and digital signal processing.
- AI Chips: These are specialized processors designed specifically for artificial intelligence workloads, such as training and inference in deep learning models. Examples of AI chips include those from NVIDIA, Intel, and Google.
- DSPs (Digital Signal Processors): These are specialized processors designed to handle signal processing tasks such as audio and video compression, speech recognition, and image processing.
- MICs (Many Integrated Core processors): These are multi-core processors designed by Intel that can handle highly parallelizable workloads.
- TPUs (Tensor Processing Units): These are specialized processors designed by Google specifically for handling machine learning workloads.
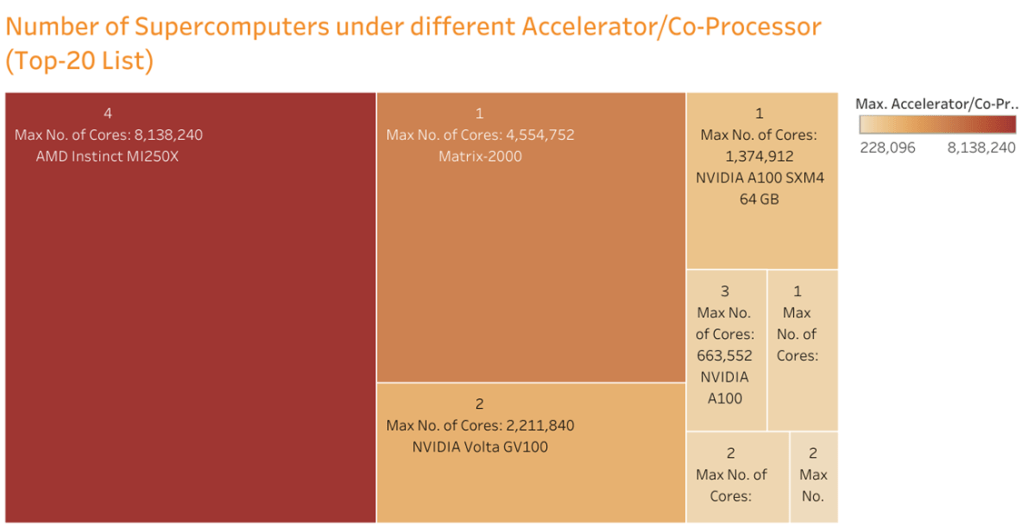
Number of Accelerator/Co-processor Cores
The number of cores in an accelerator or co-processor can vary widely depending on the specific device and system configuration.For example, a typical GPU may have thousands of cores, while an FPGA may have a few hundred to a few thousand configurable logic blocks that can be programmed to act as processing elements. Similarly, AI chips can have hundreds to thousands of specialized cores optimized for performing matrix operations commonly used in machine learning.
The number of cores in an accelerator or co-processor can have a significant impact on its performance for specific workloads. For example, a GPU with a large number of cores may be well-suited for highly parallelizable workloads such as scientific simulations, whereas an AI chip with specialized matrix multiplication cores may be more suitable for deep learning applications.
In the context of the TOP500 list, the number of accelerator or co-processor cores is often included in the system specifications to give an indication of the system’s computational power beyond just the number of traditional CPU cores.

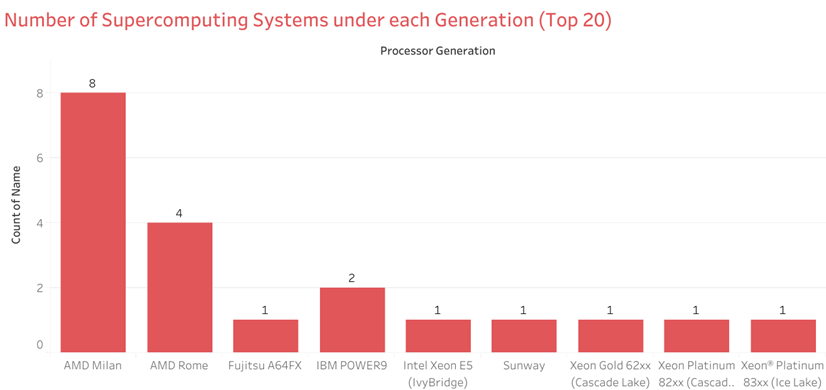
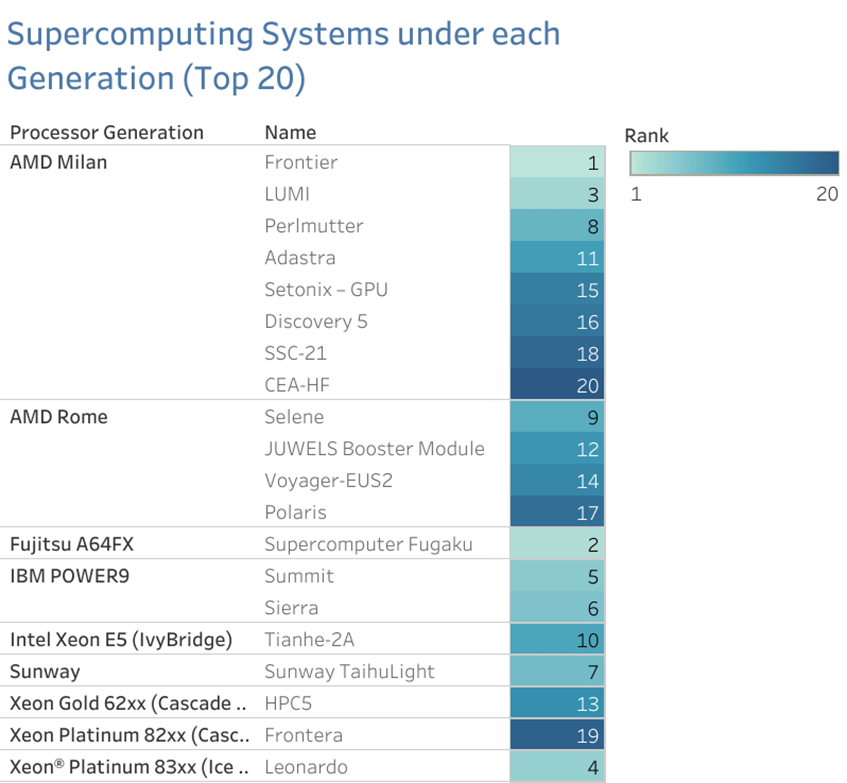
Generation
In the context of the TOP500 list, “generation” usually refers to the specific microprocessor architecture or technology node that a particular system or processor is based on.For example, Intel’s microprocessor architecture has gone through several generations over the years, including Sandy Bridge, Ivy Bridge, Haswell, Broadwell, Skylake, and more recently, the 11th generation Alder Lake processors. Similarly, AMD’s processors have gone through multiple generations, including the Ryzen and EPYC series.
Newer generations of microprocessors typically offer improvements in performance, power efficiency, and new features compared to their predecessors. Systems based on newer microprocessor generations are often more powerful and efficient than older systems.
In the context of the TOP500 list, the generation of the microprocessors used in a system is often included in the system specifications to give an indication of the system’s computational power and efficiency. It is also an important factor in determining how the system compares to other systems on the list, as newer generations of processors are often more powerful and efficient than older ones.
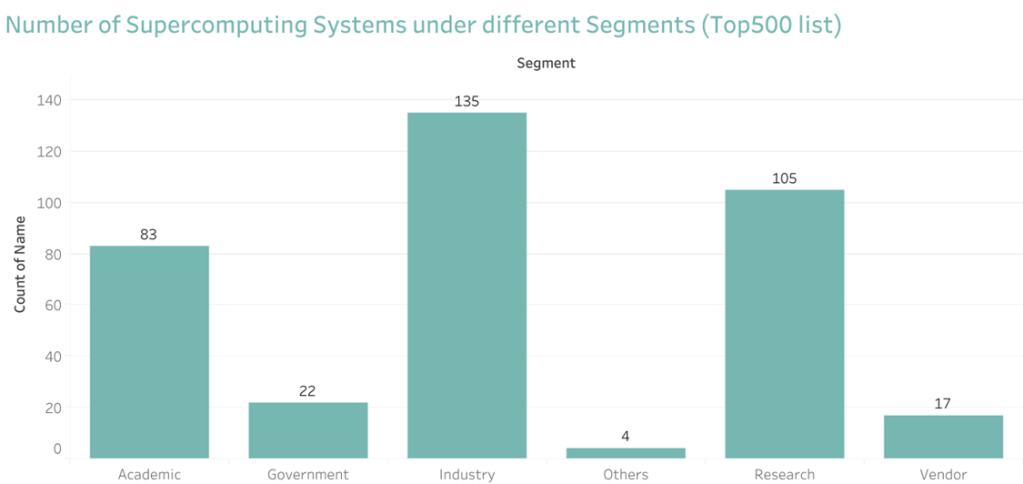
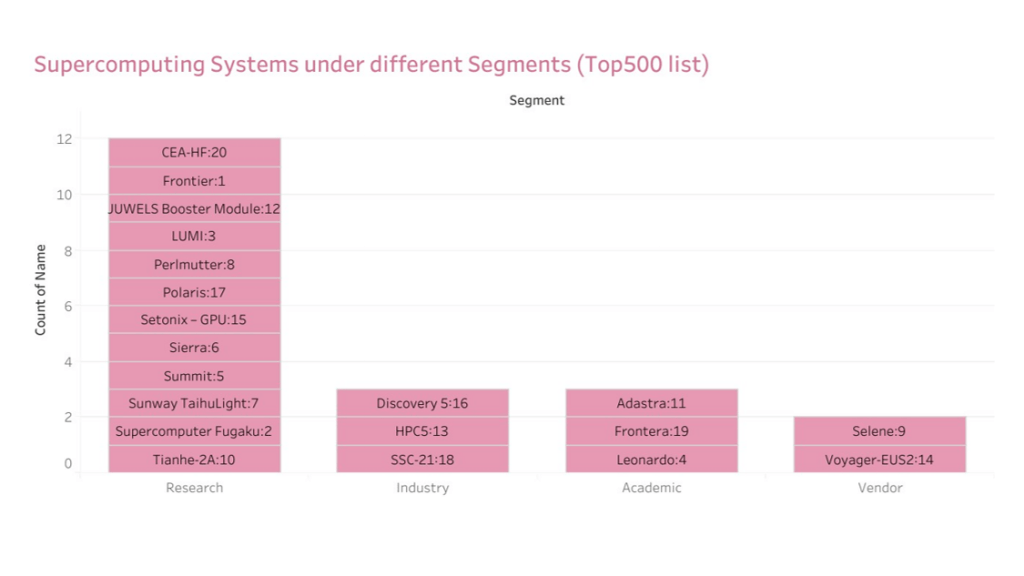
Segment
Given below are the different types of segments in Top500 list:
- Academic Segment: This includes systems that are owned and operated by academic institutions, such as universities and research institutions.
- Government Segment: This includes systems that are owned and operated by government organizations, such as national laboratories and military research facilities.
- Industry Segment: This includes systems that are owned and operated by private industry, such as technology companies and financial institutions.
- Research Segment: This includes systems that are owned and operated by research organizations, such as universities, national laboratories, and scientific research institutions.
- Vendor Segment: This includes systems that are owned and operated by vendors or technology companies, such as IBM, Cray, or Hewlett Packard Enterprise.
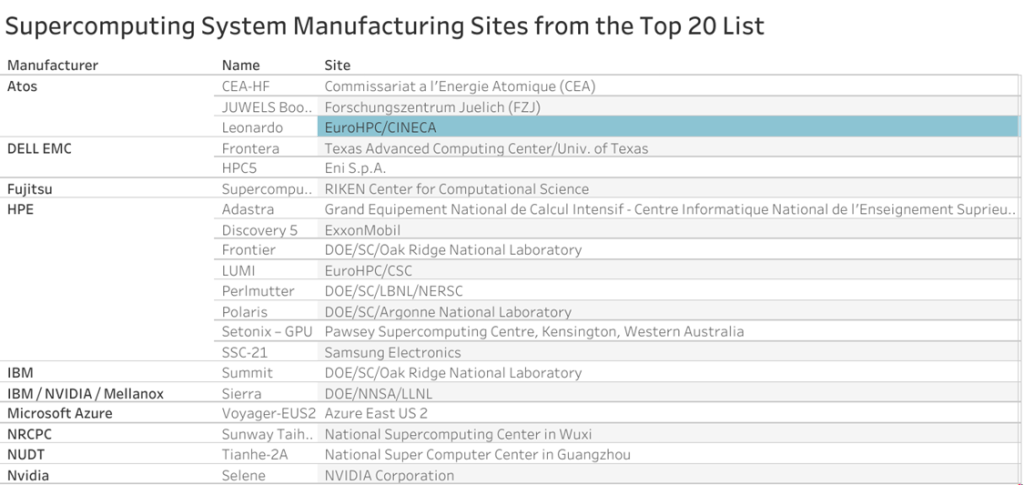
Manufacturing Sites
“Site” refers to the actual location where a supercomputer is installed and used in the context of the Top 500 supercomputer list. Depending on how well they do on the Linpack benchmark, each site may have one or several supercomputers that are listed independently on the Top 500 list.
Among other things, the location could be a research facility, a national laboratory, a university, a government organization, or a private business. The site can be located anywhere in the world as long as it satisfies the requirements for inclusion in the Top 500 list.

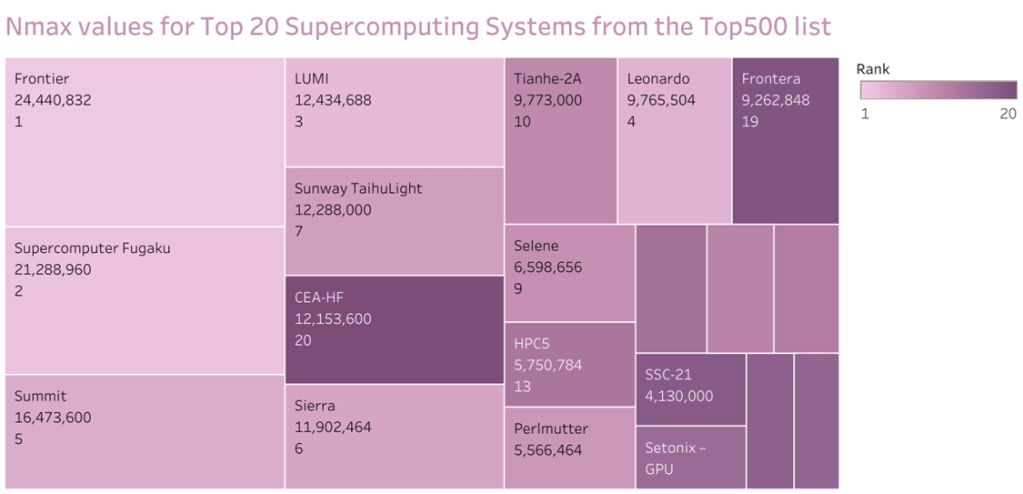
Nmax
The Linpack benchmark uses a dense system of N-dimensional linear equations to assess a supercomputer’s floating-point performance. A supercomputer’s “Nmax” is the biggest problem it can solve in a specific amount of time, usually 1 hour.
The maximum issue size that the supercomputer can tackle within the same time frame is “Nhalf,” which is half of that size.For instance, a supercomputer’s Nhalf value would be 5,000 if it could solve a problem of size Nmax=10,000 in one hour.
The Nmax and Nhalf numbers for each supercomputer are listed together with their peak Linpack performance in the Top500 list. These factors can be helpful for comparing how well various supercomputers perform on real-world applications with particular problem sizes.
Interconnect Family
A supercomputer system’s type of network interconnects is referred to as a “interconnect family”. In order for the processors, memory, and storage components of a supercomputer to cooperate and share data effectively, the network interconnect serves as its backbone. The performance and scalability of a supercomputer system can be significantly impacted by the interconnect technology chosen.
Supercomputers use a wide variety of network connectivity methods, each with unique benefits and drawbacks. InfiniBand, Ethernet, Cray Aries, IBM Blue Gene, and Intel Omni-Path are a few connectivity families that have made the Top 500 list.


VISUALIZING THE HPCG LIST
The High-Performance Conjugate Gradients benchmark, which gauges a supercomputer’s capacity to resolve a sparse system of linear equations, a typical type of issue seen in scientific simulations, is used to rate supercomputers. The purpose of the HPCG list is to provide a complementary view of the HPC ecosystem rather than to replace the TOP500 list.
HPCG Benchmark
A project called High Performance Conjugate Gradients (HPCG) Benchmark aims to provide a new metric for evaluating HPC systems.
The High Performance LINPACK (HPL) benchmark, which is currently used to rank the TOP500 computing systems, is expected to be supplemented by HPCG.
Some significant scalable applications still follow HPL’s computational and data access patterns, but not all of them.
The goal of HPCG is to develop computational and data access patterns that more closely fit a variety of essential applications.

How is HPCG list different from the Top500 list?
While the TOP500 list focuses on raw performance in solving dense linear systems, the HPCG list focuses on performance in solving sparse linear systems, and thus provides a different perspective on the capabilities of supercomputers.
| Trait | Top500 list | HPCG List |
| Number of Systems | 500 | 106 |
| Ranking based on | LINPACK (HPL) Benchmark | HPCG Benchmark |
| Measure | How quickly a system can solve a set of linear equations (focuses on matrix-matrix multiplications). | How quickly a system can solve a large system of linear equations using a conjugate gradient algorithm. |
| Important Attributes | Rpeak, Rmax (Tflops/sec) | HPCG(Tflops/sec) |
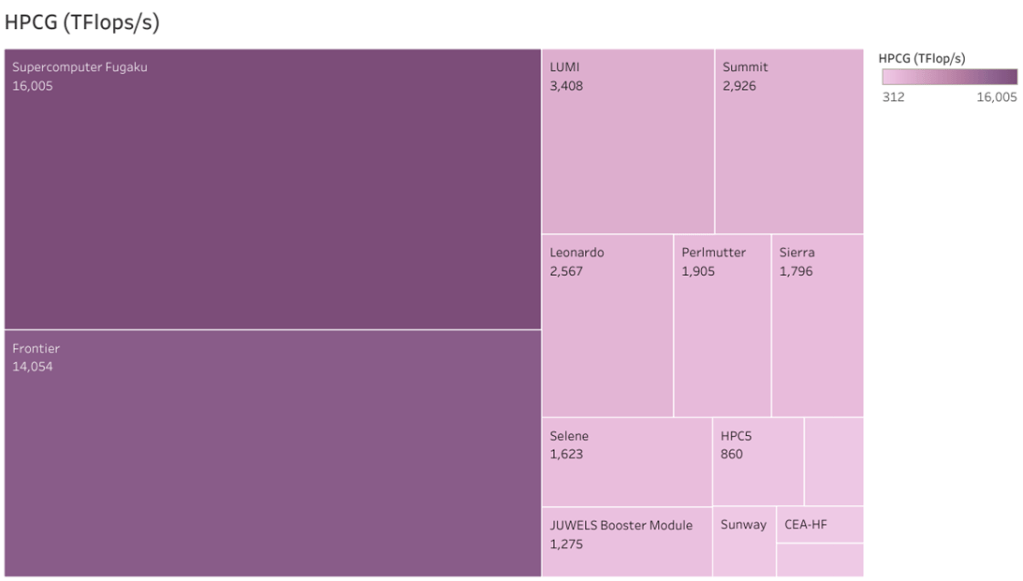
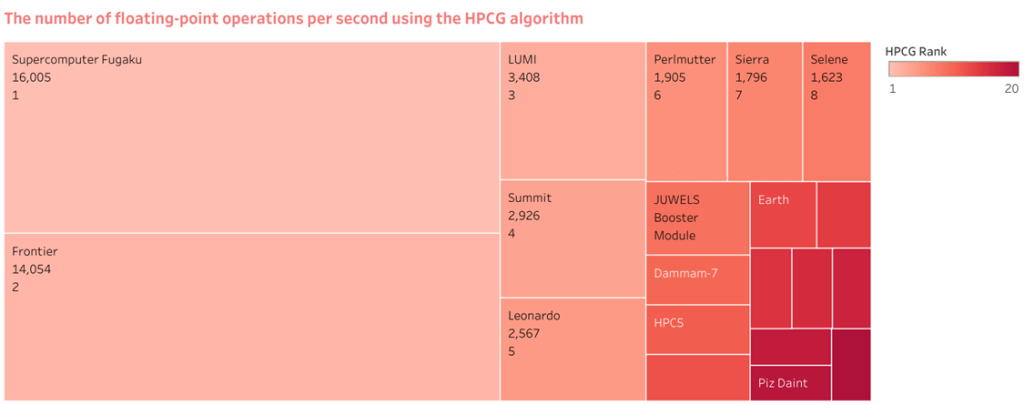
One of the performance criteria included in the TOP500 list, along with Linpack benchmark results, is the HPCG (High Performance Conjugate Gradients) metric. The HPCG meter gauges how well a supercomputer performs when utilizing the High Performance Conjugate Gradients algorithm to solve a sparse system of linear equations.
The number of floating-point operations per second that the supercomputer can complete when employing the HPCG algorithm to solve the sparse system of equations is measured by the HPCG metric, which is expressed in terms of TFlop/s (teraflops per second). In contrast to the Linpack benchmark, which assesses a supercomputer’s ability to solve a complex system of linear equations, the HPCG metric offers a distinct viewpoint on its performance.
The TOP500 list has incorporated the High-Performance Conjugate Gradient (HPCG) benchmark results, which provide an alternative metric for assessing supercomputer performance. This score is meant to complement the HPL measurement to give a fuller understanding of the machine. The High-Performance Conjugate Gradient (HPCG) benchmark is a tool for ranking computer systems based on a simple additive Schwarz, symmetric Gauss-Seidel preconditioned conjugate gradient solver.
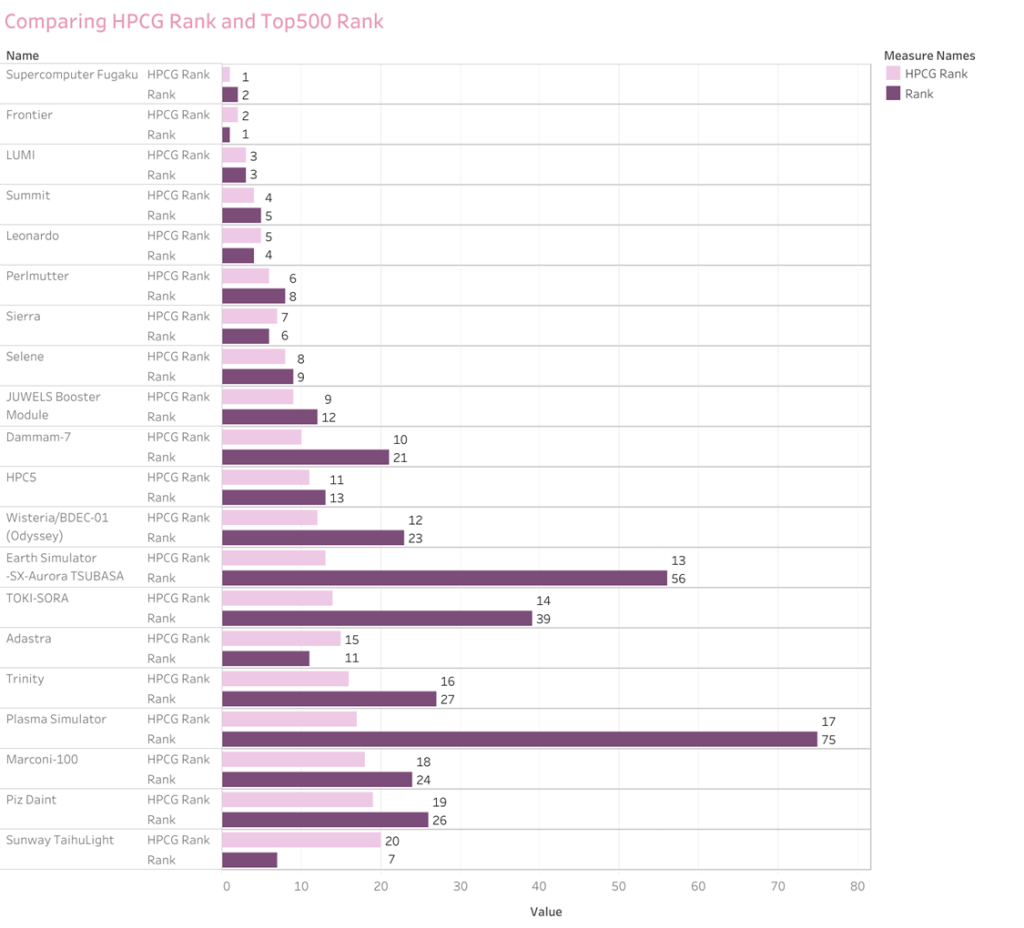
The winner of this list, like the last list, is Fugaku with a score of 16.0 HPCG-petaflops. Unlike the last list, Frontier has submitted HPCG data and achieved an HPCG score of 14.054 HPCG-petaflops. This puts it at the No. 2 spot above LUMI, which scored 3.408 HPCG-petaflops.
Rank

Fugaku’s accomplishment and proof to its exceptional performance qualities is its ranking at the top of the High-Performance Conjugate Gradient (HPCG) list. The HPCG benchmark is made to assess how well supercomputers can solve a challenging set of linear equations, a task that is essential in many scientific and engineering disciplines. The Japanese supercomputer Fugaku has been acclaimed as the most potent in the world, and its ranking on the HPCG list is another proof of its prowess. With a design specifically tuned for high-performance computing workloads and a Fujitsu A64FX processor at its core, the supercomputer can do more than 415 quadrillion operations per second.

Observation
Fugaku Supercomputer, though has a lesser number of cores than its counterpart Frontier, managed to top the HPCG list.


CONCLUSION
We came up with a total of 45 visualizations covering almost all the attributes from the Top500 list and the HPCG list. The below table summarises the type and count of visualizations. We published the visualizations on Tableau Public and have received 127 views so far. Given below are the links to navigate to the published visualizations:
References
- Dongarra, J., Simon, H. D., & Meuer, H. W. (2020). The TOP500 list and HPCG benchmark: Measuring the performance of the world’s fastest supercomputers. Journal of Parallel and Distributed Computing, 144, 1-12.
- Sterling, T. (2019). The TOP500 supercomputer list: trends, issues, and implications. Computing in Science & Engineering, 21(4), 76-83.
- Tang, Y., & Li, S. (2018). Analysis of Top500 supercomputers in the big data era. Journal of Supercomputing, 74(4), 1838-1854.
- Morrison, J. P., & Carver, J. C. (2017). The history and future of the Top500 list. Computing in Science & Engineering, 19(6), 44-53.
- Li, X., Huang, X., & Tan, X. (2016). Trends and challenges of parallel computing on modern HPC platforms: a case study of the top500 systems. Future Generation Computer Systems, 58, 23-30.
- “Reshaping Pandas Dataframes using Melt And Unmelt – GeeksforGeeks,” GeeksforGeeks, Sep. 22, 2020. [Online]. Available: https://www.geeksforgeeks.org/reshaping-pandas-dataframes-using-melt-and-unmelt/
- Zach and V. all posts by Zach, “How to Fix: ValueError: Index contains duplicate entries, cannot reshape – Statology,” Statology, Nov. 23, 2021. [Online]. Available: https://www.statology.org/valueerror-index-contains-duplicate-entries-cannot-reshape/
- “Build a Packed Bubble Chart,” Build a Packed Bubble Chart – Tableau. [Online]. Available: https://help.tableau.com/current/pro/desktop/en-us/buildexamples_bubbles.htm
- “Tableau Software – Wikipedia,” Tableau Software – Wikipedia, Sep. 01, 2022. [Online]. Available: https://en.wikipedia.org/wiki/Tableau_Software
- “In high-performance computing, what are Rmax and Rpeak?,” In high-performance computing, what are Rmax and Rpeak? [Online]. Available: https://kb.iu.edu/d/bbzo
